Diversity Demographics
Student Population Fall 2024
- Total Students: 4,540
- Undergraduate Students: 3,825
- Graduate Students: 715
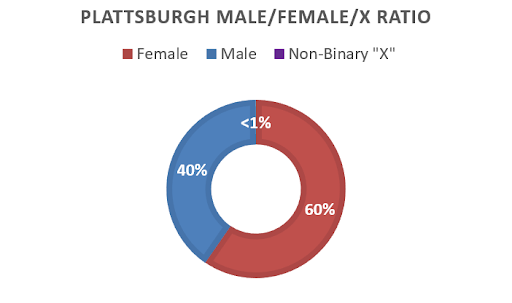
Undergraduate Student Population
- By Sex
Plattsburgh Male/Female/X Ratio
- Female: 2,247
- Male: 1,541
- X: 37
- By Race/Ethnicity
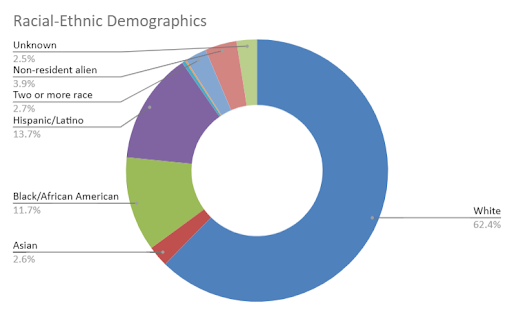
Racial/Ethnic Demographics — Undergraduate
Race/Ethnicity Number Percentage American Indian or Alaska Native 16 0.4% Asian 99 2.6% Black or African American 446 11.7% Hispanic 525 13.7% International 150 3.9% Multi-ethnic 102 2.7% Other 6 0.2% Unknown 96 2.5% White 2,385 62.4%
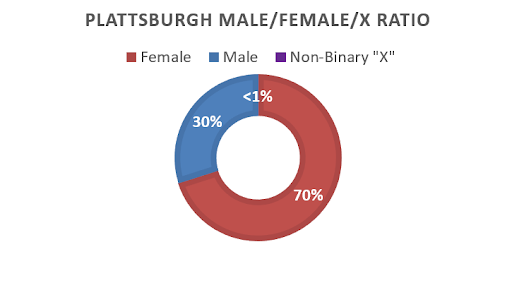
Graduate Student Population
- By Sex
Plattsburgh Male/Female/X Ratio
- Female: 498
- Male: 213
- Non-binary: 4
- By Race/Ethnicity
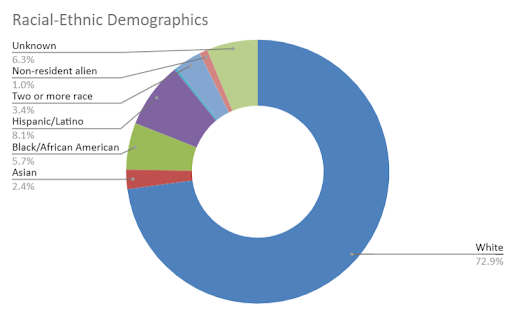
Racial/Ethnic Demographics — Graduate
Race/Ethnicity Number Percentage American Indian or Alaska Native 2 0.3% Asian 17 2.4% Black or African American 41 5.7% Hispanic 58 8.1% International 7 1.0% Multi-ethnic 24 3.4% Other - - Unknown 45 6.3% White 521 72.9%
Additional Diversity Demographics — Undergraduate & Graduate Combined
- Geographic Diversity
Domestic Student Population by State
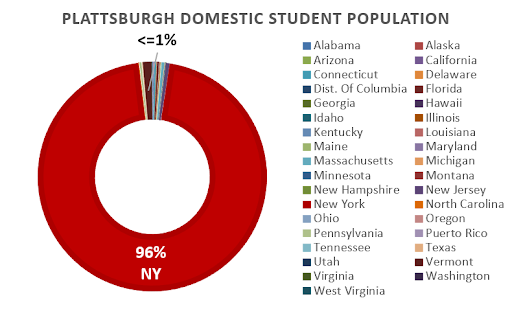
The above chart shows SUNY Plattsburgh population by state with New York state making up 96% of the domestic student population.
Top 5 States
- New York: 4,186 students
- Vermont: 50 students
- New Jersey: 22 students
- Massachusetts: 17 students
- Connecticut: 13 students
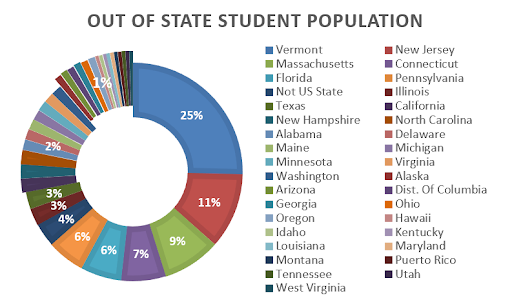
Out-of-State Student Population by State
State Number of Students Percentage Alabama 3
1.5% Alaska 2 1.0% Arizona 2 1.0% California 4 2.0% Connecticut 13 6.6% Delaware 3 1.5% District of Columbia 2 1.0% Florida 12 6.1% Georgia 2 1.0% Hawaii 1 0.5% Idaho 1 0.5% Illinois 5 2.5% Kentucky 1 0.5% Louisiana 1 0.5% Maine 3 1.5% Maryland 1 0.5% Massachusetts 17 8.6% Michigan 3 1.5% Minnesota 3 1.5% Montana 1 0.5% New Hampshire 4 2.0% New Jersey 22 11.2% North Carolina 4 2.0% Not U.S. State 7 3.6% Ohio 2 1.0% Oregon 2 1.0% Pennsylvania 11 5.6% Puerto Rico 1 0.5% Tennessee 1 0.5% Texas 5 2.5% Utah 1 0.5% Vermont 50 25.4% Virginia 3 1.5% Washington 3 1.5% West Virginia 1 0.5% - International Students
- Percentage of students from out of the country: 4.9%
- Total countries represented: 34
Top 5 Countries
- India: 37 students
- Nepal: 26 students
- Canada: 21 students
- Ethiopia: 14 students
- Japan: 13 students
- Student Age Diversity
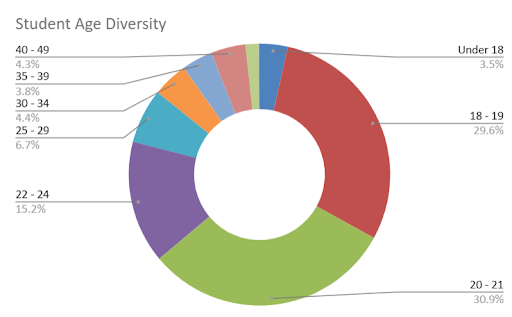
Plattsburgh Student Age Diversity
Student Age Group Number of Students 18-19 1,342 20-21 1,401 22-24 688 25-29 306 30-34 198 35-39 174 40-49 194 50-64 74 65 & Over 5 Under 18 158
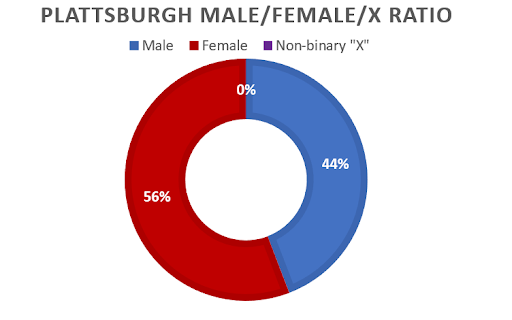
Employee Population Fall 2024
The following are based on approximately 504 female employees and 399 male employees.
Employee Demographics
- By Sex
Plattsburgh Male/Female/X Ratio
- Female: 56%
- Male: 44%
- X: 0%
- By Race/Ethnicity
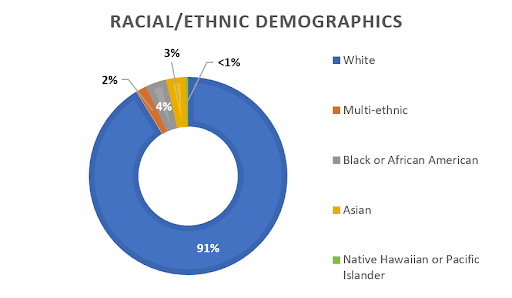
Racial/Ethnic Demographics — Employee
Race/Ethnicity Number Percentage American Indian or Alaska Native 0 0 Asian 29 3.2% Black or African American 31 3.4% Hispanic 0 0 Multi-ethnic 16 1.8% Native Hawaiian or Pacific Islander 3 0.3% Unknown 0 0 White 824 91.3%